
(Return to Table of Contents Page)
The following are three sets of graphed data addressing how OPT may be seen to play out across race. The first set of graphs below compares the association between the Presage variable and the percent of African American and the percent white of the district student population. The second set represents the association of OPT performance as a function of African American and white student populations. The third set gives a comparison of performance controlling for the Presage variable. It is vital that these three sets of findings be viewed together for optimal understanding of the general comparative effects of OPT on these two groups.
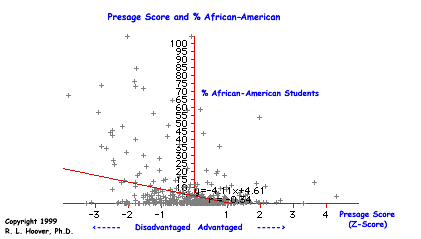
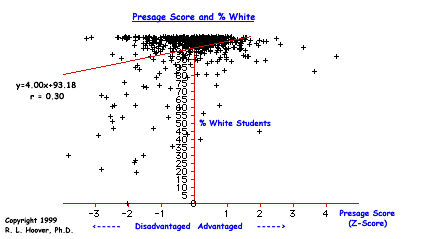
The first graph in the set tells us that there is a moderate negative correlation between advantagement and the percent African American district population. The second one shows that there is a moderate positive correlation between advantagement and the percent white population of the district. Taken together, the findings support the argument that the effects of social-economic advantagement-disadvantagement are seen in the racial composition of Ohio's school districts. The next set of graphs represent the findings of how race is associated with OPT performance.
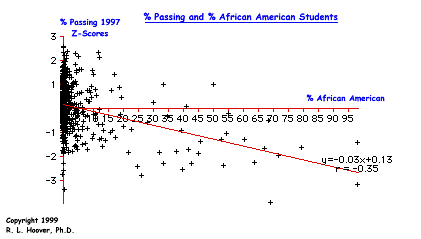
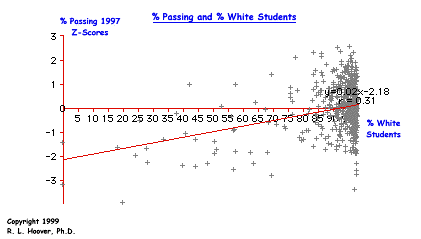
This set of graphs shows us that there is a moderately significant differential between African American and white performance on the OPT. The first graph in the set tells us that the greater the percent African American in the district, the more likely fewer students will be achieving passing OPT scores. The second one shows the opposite for white students.
Two points for objective interpretation are very important here. The first point is that the findings definitely reveal OPT bias against students in predominantly African American school districts. It is also logically true that the findings may be interpreted as definitely revealing OPT bias in favor of predominantly white school districts.
The second important point is that, while the effects are real in terms of bias, it cannot and must not be concluded that the bias is caused directly by racial differences between the two groups. So, while the findings do show the racial bias to be real, attributing the bias to a specific source requires more critical examination of the data. This is so because we have already found that social-economic advantagement-disadvantagement plays out in association with race as is shown in the first set of graphs in this section.
Indeed, it is somewhat interesting that the correlation coefficients for the first two sets of graphs are quite strikingly similar (r=-0.34, r=0.030 and r=-0.35, r=0.31). Adding to this observation to the fact that we know from the primary findings of this study that the Presage factor is unusually powerful as a variable (r=0.80) of advantagement-disadvantagement for predicting OPT performance, to determine first-order racial/cultural OPT effects we need to examine actual OPT performance, controlling for the Presage factor. In other words, the racial differential shown in this second set of graphs must be examined further before suggesting that it is caused by racial/cultural differences.
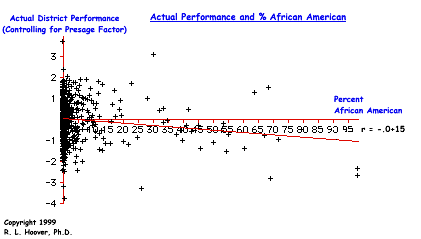
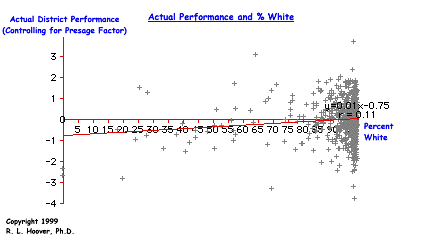
The graphs showing actual performance (performance controlling for the Presage variable) for white and for African American populations both yield non-significant effects in and of themselves. These non-statistically significant effects are, however, very significant in understanding and knowing that when the playing field of advantage-disadvantage is even, race is not the primary factor affecting academic achievment in terms of district level OPT performance.
However, given the correlations (r=-0.15 for African Americans and r=0.11 for whites) we do see effects that could very well represent racial/cultural bias inherent in the tests. Together, all three sets of comparisons re-confirm that social-economic-environmental factors that create the conditions of advantagement-disadvantagement is the clear bias of OPT regardless of race. In other words, disadvantaged children are likely to perform poorly on the test regardless of race. The first two sets of graphs do tell us that African American children are more likely to suffer from the conditions of disadvantagement that are white children and, that because of this powerful effect far more African American children are victims of OPT bias than are white children. Likewise, the last set of graphs suggests that there is most likely some racial/cultural bias in the test. Though the effect of this bias on district level performance is significantly less than the effect of the Presage factor, it does make a difference especially in districts with high African American student populations because passing rates load so powerfully on the Ohio School Report Card ratings.
If indeed, the third set of graphed data is showing the artifacts of inherent racial/cultural bias, then the effects are particularly significant for individual African-American students in Ohio's schools. My own professional judgment tells me that this scenario is probable given the legacy of racial/cultural bias in standardized testing. At the very least, these data indicate a moral responsibility and a legal obligation on the part of the State of Ohio to suspend testing until further study of the racial/cultural bias is openly and honestly conducted. Last, it is vital to recognize that the data represented in all three sets of graphs removes from discourse and discussion the question of African American students ability to learn as well as other racial groups. There is simply no evidence whatsoever to support any arguments regarding their academic performance. Therefore, for anyone to make the claim that African American children do not have the same native ability as whites in terms of academic achievment is as absurd as it is ignorant and racist.