|Advisement Page
|ClassConnections Page|
Hoover's Scheduled Classes|
|Summer Graduate Film Workshop|
|Graduate Programs|
|Hoover's Teacher Resource Site|

 (Return to Table of Contents Page)
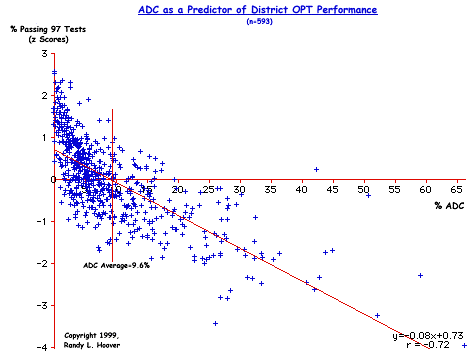
ADC as a Predictor of District OPT Performance
This graph shows the degree of association between the percent of district students receiving ADC and the percent passing the OPT. The correlation between ADC and students not passing is extremely high (r=-0.72). The correlation is inverse, meaning that the greater the number of students receiving ADC in a district, the lower the percent of students passing.
Given that ADC is clearly a measure of economic and social advantage-disadvantage, these findings strongly support the idea that the OPT is far more a measure of the lived experience of the student than a measure of what occurs in schools and classrooms. Expressed in terms of prediction, these data indicate that the percent of students in a school district receiving ADC is a powerful predictor of overall district performance: The greater the number of ADC students, the lower the percent passing.

