|Advisement Page
|ClassConnections Page|
Hoover's Scheduled Classes|
|Summer Graduate Film Workshop|
|Graduate Programs|
|Hoover's Teacher Resource Site|

 (Return to Table of Contents Page)
State Economic Disadvantagement Data as a Predictor of District OPT Performance
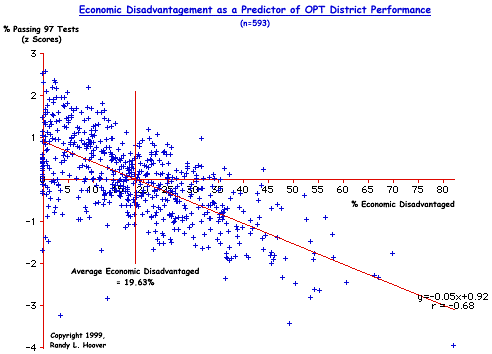
This graph shows the association between economic disadvantagement and percent passing. Though vague in its definition, the State of Ohio uses this as a measure of economic status given to all Ohio school districts and is included in the data presented by EMIS. These data clearly indicate (r=-0.68) another strong relationship between social-economic factors and OPT performance. As with other similar measures, the relationship is inverse in that the greater the economic disadvantagement, the lower the percent passing.
This part of the OPT research again strongly supports the idea that the validity of OPT is in grave doubt, a conclusion certainly warranted by the findings of the study in its entirety. Seen another way, this ODE measure of advantage-disadvantage works well as a predictor of district performance reinforcing the finding that performance on the test is primarily a function of non-school factors.

