|Advisement Page
|ClassConnections Page|
Hoover's Scheduled Classes|
|Summer Graduate Film Workshop|
|Graduate Programs|
|Hoover's Teacher Resource Site|

 (Return to Table of Contents Page)
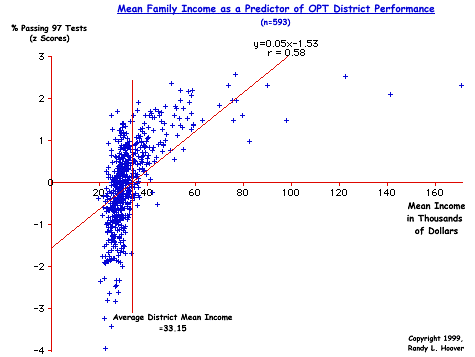
Mean Family Income as a Predictor of District OPT Performance
This graph shows the association of mean family income with the percent passing the OPT. This analysis and graph are striking for several reasons. First is the correlation (r=-0.58) between income and passing that shows mean family income to be a relatively strong predictor. Though lower than all other coefficients of advantage-disadvantage found in this study, the correlation coefficient is still in the range of being a strong predictor and is more typical of correlation coefficients found in high correlation social science studies.
The graphing is also interesting from the standpoint that the association is non-linear as can be easily seen by observing the curved nature of the data points. This array tells us that the correlation coefficient is underestimating the actual correlation. In other words, we can be reasonable confident that mean family income predicts test performance more than this statistical operation indicates. As with the other tests of advantage-disadvantage in this study, mean income as a measure of advantage- disadvantage is powerful in predicting district performance thereby providing additional evidence that district OPT performance is far more a function of social-economic conditions than of classroom and school variables.