|Advisement Page
|ClassConnections Page|
Hoover's Scheduled Classes|
|Summer Graduate Film Workshop|
|Graduate Programs|
|Hoover's Teacher Resource Site|


(Return to Table of Contents Page)
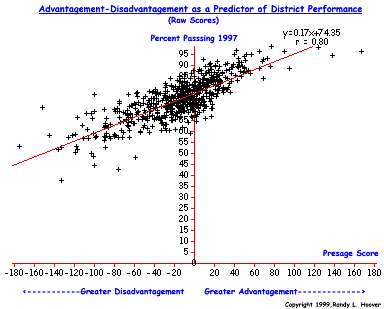
Presage Factor as a Predictor of District OPT Performance: Raw Score Graph
This graph shows the power of the Presage Factor as a measure of advantage-disadvantage in predicting district test performance. The "Y" axis represents the mean percent of a district's students passing across the four sections of the 4th, 6th, 9th, and 12th grade OPT's: %Passing = [(%4Math + %4Reading + %4Writing + %4Citizenship + %6Math + %6Reading + %6Writing + %6Citizenship + %9Math + %9Reading + %9Writing + %9Citizenship + %12Math + %12Reading + %12Writing + %12Citizenship)/16]. The "X" axis represents the Presage Factor expressed in raw scores. The Presage score is a measure of the degree of disadvantage-advantage derived from EMIS data and combines and averages A.D.C., School Lunch Subsidies, Economic Disadvantagement, and Mean Income of each school district.
From the data analysis represented in the graph below, we know that district performance is associated with non-school environmental conditions of advantage-disadvantage to the extent of r = 0.80. This is an extremely high association and clearly brings the entire validity of the OPT's into serious question. In other words, the findings of this study show clearly that what might generally be called "economic conditions" are an incredibly powerful predictor of OPT performance. Because of the discovery that OPT performance is overwhelmingly determined by the economic conditions which the students of the district experience growing up, the inexcapable conclusion is that OPT is not a valid measure of either school or teacher effectiveness and should not be used for accountability assessment. The OPT is invalid because the results of this study show that it does not measure what it claims to measure: Student performance on the OPT is, at best, academically meaningless. It is highly biased against economically disadvantaged students and clearly favors economically advantaged students.
A graphing of the same data using Z-scores can be found HERE.


