|Advisement Page
|ClassConnections Page|
Hoover's Scheduled Classes|
|Summer Graduate Film Workshop|
|Graduate Programs|
|Hoover's Teacher Resource Site|


(Return to Table of Contents Page)
Presage Factor as a Predictor of District OPT Performance: z-Score Graph
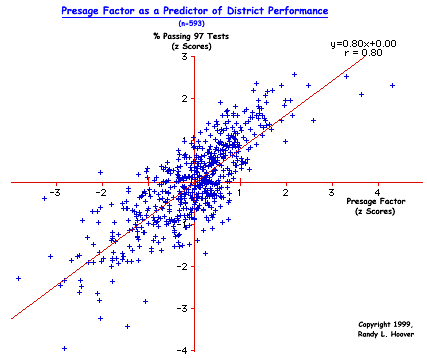
This graph shows the power of the Presage Factor in predicting district test performance. The "Y" axis represents the mean percent of a district's students passing across the four sections of the 4th, 6th, 9th, and 12th grade OPT's transformed into a z-score: %Passing = [(%4Math + %4Reading + %4Writing + %4Citizenship + %6Math + %6Reading + %6Writing + %6Citizenship + %9Math + %9Reading + %9Writing + %9Citizenship + %12Math + %12Reading + %12Writing + %12Citizenship)/16] converted into z-score by subtracting the mean of the population (n=593) and dividing by the standard deviation of the distribution.
The "X" axis represents the Presage Factor converted into z-scores. The formula will be shown and discussed in class, but will not be released until the study is finalized and made public. From these data, a ranking of actual district performance is possible to calculate based upon the residual effects seen in the graph. Residuals represent the difference between how the district performs compared to how it is predicted to perform using the power of the Presage Factor. Actual or at least a much more accurate view of district performance may be seen when Presage effects are eliminated.
These residuals may be seen to represent actual district performance controlling for the Presage Factor of non-school, socio-economic variables. A graph of district OPT performance controlling for the Presage effects can be found HERE. In addition, a ranking of Ohio's top performing districts in terms of actual performance may be found HERE. From the data analysis represented in the graph below, we know that district performance is associated with non-school environmental conditions to the extent of r = 0.80. This is an extremely high association and clearly brings the entire validity of the OPT's into serious question. In other words, the findings of this study show clearly that the OPT is not a valid measure of either school or teacher effectiveness and should not be used for accountability assessment. Likewise, the OPT test is invalid because the results of this study show that it does not measure what it claims to measure, individual student performance is at best, meaningless.
A graphing of these variables using raw scores instead of z-scores can be found HERE.


